import ephem, datetime, re
import matplotlib.pyplot as plt
import pandas as pd
import numpy as np

planets = pd.DataFrame()
planets['body'] = [ephem.Mercury(),
                  ephem.Venus(),
                  ephem.Mars(),
                  ephem.Jupiter(),
                  ephem.Saturn(),
                  ephem.Uranus(),
                  ephem.Neptune()]
planets['name'] = planets['body'].apply(lambda x: x.name)
planets['color'] = ['r', 'g', 'b', 'k', 'm', 'c' , 'y']  # for plotting later
planets
Loading...
# parse data from https://promenade.imcce.fr/en/pages6/887.html
prom = pd.DataFrame(columns=['type', 'planet', 'date', 'time', 'elong', 'dec'])
with open('../data/greatest_elongations.txt') as fp:
    lines = fp.read().splitlines()
    for line in lines:
        s_head = re.search(r'Dates of the .* of (.*) from', line)
        if s_head==None:
            s_date = re.search(r' (\d{4} [A-Z][a-z]{2} .\d) ', line)
            if s_date!=None:
                idx = len(prom)
                prom.loc[idx, 'type'] = typ
                prom.loc[idx, 'planet'] = planet
                prom.loc[idx, 'date'] = s_date.group(1)
            if typ=='largest elongation':
                s_elong = re.search(r' (\d{2}\.\d..)', line)
                if s_elong!=None:
                    prom.loc[idx, 'elong']  = s_elong.group(1)
            elif typ=='opposition':
                s_time = re.search(r' (\d{2}:\d{2}) ', line)
                if s_time!=None:
                    prom.loc[idx, 'time'] = s_time.group(1)
                s_dec = re.search(r'   (.\d{2}..\d{2}.)', line)
                if s_dec!=None:
                    prom.loc[idx, 'dec']  = s_dec.group(1)
        else:
            planet = s_head.group(1)
            typ = re.search(r'Dates of the (.*) of', line).group(1)[:-1]
            typ = typ.replace('largerst', 'largest')
            year0 = re.search(r'Dates of the .* of .* from (.*) to', line).group(1)
            year1 = re.search(r'Dates of the .* of .* from .* to (.*).', line).group(1)
            print(planet, typ, year0, year1)

prom['date'] = pd.to_datetime(prom['date'])
assert prom.loc[prom['dec'].isna(), 'type'].unique() == 'largest elongation'
assert prom.loc[prom['time'].isna(), 'type'].unique() == 'largest elongation'
assert prom.loc[prom['elong'].isna(), 'type'].unique() == 'opposition'
assert prom.loc[prom['type']=='largest elongation', 'dec'].isna().all()
assert prom.loc[prom['type']=='largest elongation', 'time'].isna().all()
assert prom.loc[prom['type']=='opposition', 'elong'].isna().all()
assert prom.loc[prom['type']=='largest elongation', 'date'].min().year >= 2014
assert prom.loc[prom['type']=='largest elongation', 'date'].max().year <= 2029
assert prom.loc[prom['type']=='opposition', 'date'].min().year >= 1950
assert prom.loc[prom['type']=='opposition', 'date'].max().year <= 2099
prom
Mercury largest elongation 2014 2029
Venus largest elongation 2014 2029
Mars opposition 1950 2099
Jupiter opposition 1950 2099
Saturn opposition 1950 2099
Uranus opposition 1950 2099
Neptune opposition 1950 2099
Loading...
def ew2pm(x):
# convert E-or-W notation in elong to plus/minus (see the two columns elong and elong_ew2pm)
    x = str(x)
    if x[-1]=='E':
        return float(x[:-2])
    elif x[-1]=='W':
        return -float(x[:-2])
prom['elong_ew2pm'] = prom.apply(lambda x: ew2pm(x.elong), axis=1)
prom
Loading...
# for each row of data in prom, lookup elongation from ephem
def grab_elong(x):
    planet = planets.loc[planets['name']==x.planet, 'body'].values[0]
    planet.compute(x.date)
    return np.rad2deg(planet.elong)
prom['elong_lookup'] = prom.apply(lambda x: grab_elong(x), axis=1)
prom
Loading...
tis, tat = prom['elong_ew2pm'], prom['elong_lookup']
# find disagreement betwen tis and tat (for "this" and "that")
# we start with an eyeball inspection
plt.plot(prom['elong_ew2pm'], prom['elong_lookup'], '.')
plt.xlabel('elong_ew2pm'); plt.ylabel('elong_lookup')
plt.grid(True)
# looks good: points fall along a diagonal line x=y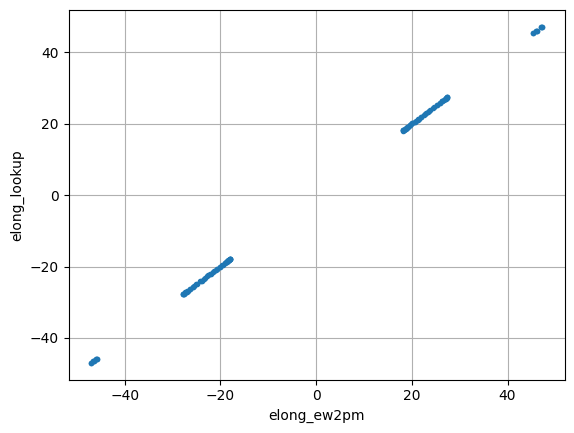
# take disagreement as the ratio of difference (between the two) to the average (of the two)
disagreement = 2*(tis-tat)/(tis+tat)
disagreement.describe()
# disagreement is small, as expected, so we are good
# can't expect anything better, as the original value (elong) was given to one decimal place only
count 121.000000
mean 0.000567
std 0.001340
min -0.002408
25% -0.000462
50% 0.000528
75% 0.001513
max 0.003761
dtype: float64# elongation at opposition should always be around -180 or 180
elong_at_opposition = prom.loc[prom['type']=='opposition', 'elong_lookup']
mmin = elong_at_opposition.min()
mmax = elong_at_opposition.max()
assert np.allclose(mmin, -180, rtol=1e-3)
assert np.allclose(mmax, 180, rtol=1e-2)
elong_at_opposition.describe()
# looks goodcount 650.000000
mean -176.260900
std 27.925673
min -179.923386
25% -179.165100
50% -178.706879
75% -178.138222
max 179.229126
Name: elong_lookup, dtype: float64# sanity-check textbook values
prom.loc[prom['type']=='largest elongation'].groupby('planet')['elong_ew2pm'].min()planet
Mercury -27.8
Venus -47.0
Name: elong_ew2pm, dtype: float64prom.loc[prom['type']=='largest elongation'].groupby('planet')['elong_ew2pm'].max()planet
Mercury 27.4
Venus 47.2
Name: elong_ew2pm, dtype: float64# sweep ephem through 5 years and from the values, find the min-max range for each planet
sweep = pd.DataFrame(columns=['planet', 'date', 'elong_rad'])
for idx, dat in planets.iterrows():
mytime = datetime.datetime(2026, 1, 1, 0, 0)
dat['body'].compute(mytime)
elong0 = dat['body'].elong
rmember = elong0
for _ in range(200):
mytime += pd.DateOffset(weeks=1)
dat['body'].compute(mytime)
elong = dat['body'].elong
sweep.loc[len(sweep)] = [dat['name'], mytime, elong]
# if rmember<elong0 and elong>elong0:
# break
rmember = elong
sweep['elong_deg'] = sweep['elong_rad'].apply(lambda x: np.rad2deg(x))
sweepLoading...
plt.figure(figsize=(15,7))
for planet, dat in sweep.groupby('planet'):
    plt.plot(dat['date'], dat['elong_deg'], label=planet, color=planets.loc[planets['name']==planet, 'color'].values[0])
plt.legend(); plt.grid()
mmin = sweep.groupby('planet')['elong_deg'].min()
mmin.name = 'elong_min'
mmin
planet
Jupiter -178.945847
Mars -174.963043
Mercury -27.729191
Neptune -177.490036
Saturn -175.390732
Uranus -175.943848
Venus -46.917679
Name: elong_min, dtype: float64mmax = sweep.groupby('planet')['elong_deg'].max()
mmax.name = 'elong_max'
mmaxplanet
Jupiter 175.923065
Mars 173.992599
Mercury 27.189339
Neptune 177.954865
Saturn 176.343689
Uranus 179.836441
Venus 46.996708
Name: elong_max, dtype: float64# merge mmin and mmax into dataframe 'planets'
planets = pd.merge(planets, mmin, left_on='name', right_index=True)
planets = pd.merge(planets, mmax, left_on='name', right_index=True)
planetsLoading...