Getting started
Dice
Circles
Statistics & histograms
More loops
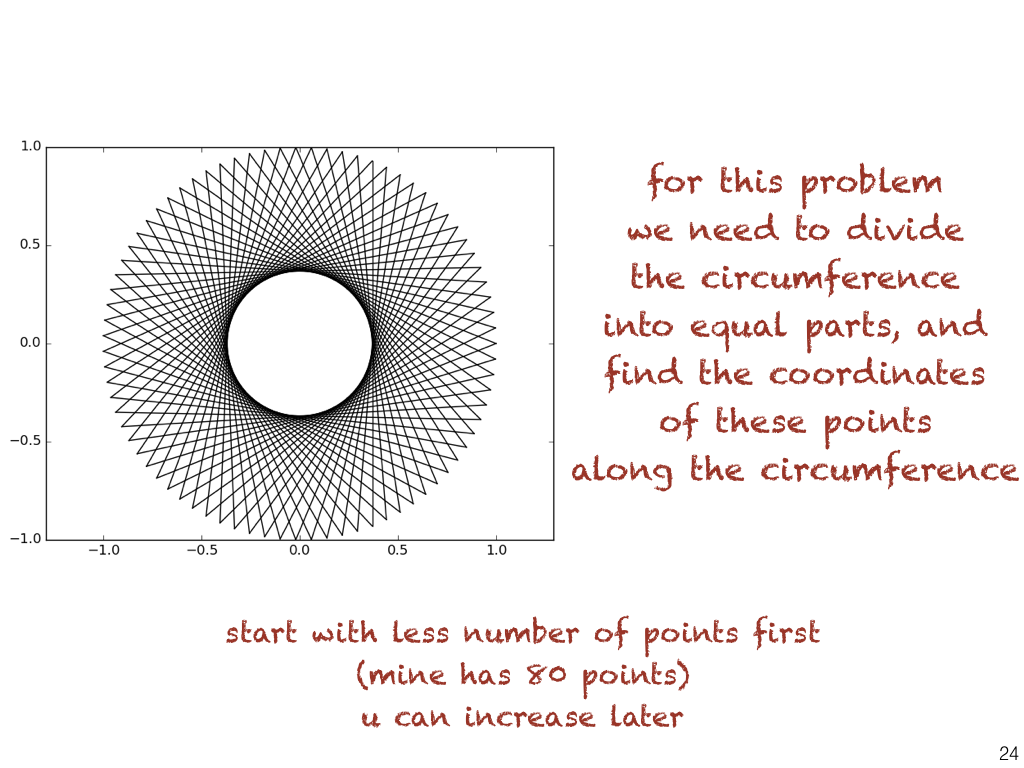
Pretty nets
Jumping man
Medical scans
Handwriting recognition
Flower recognition
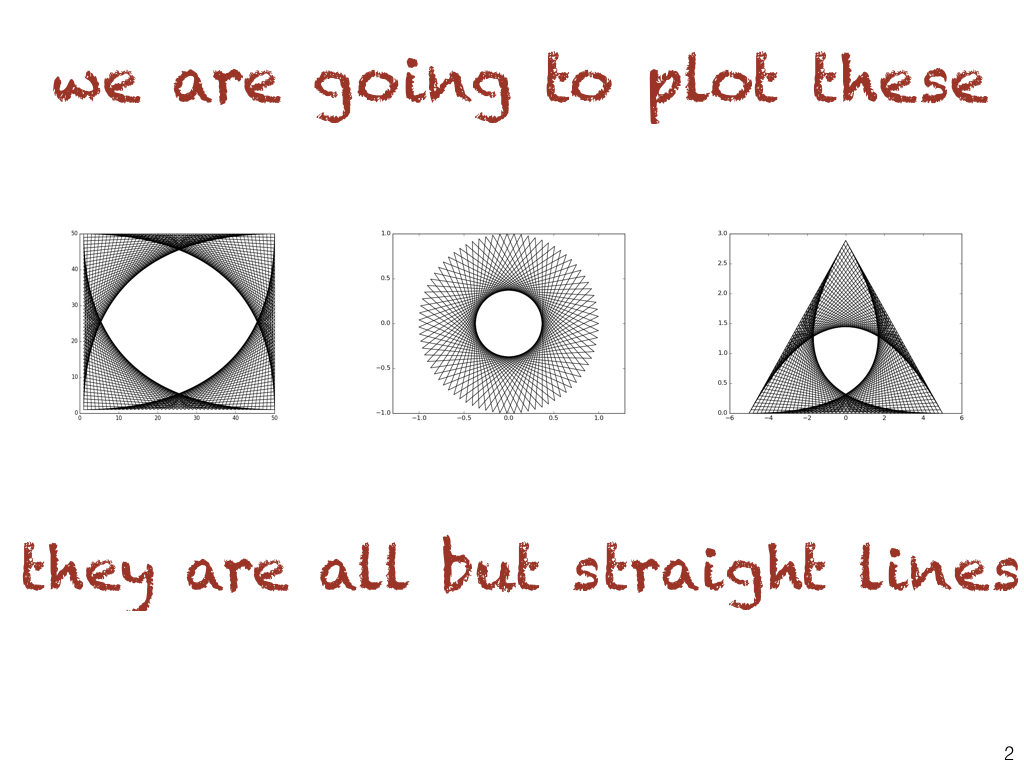
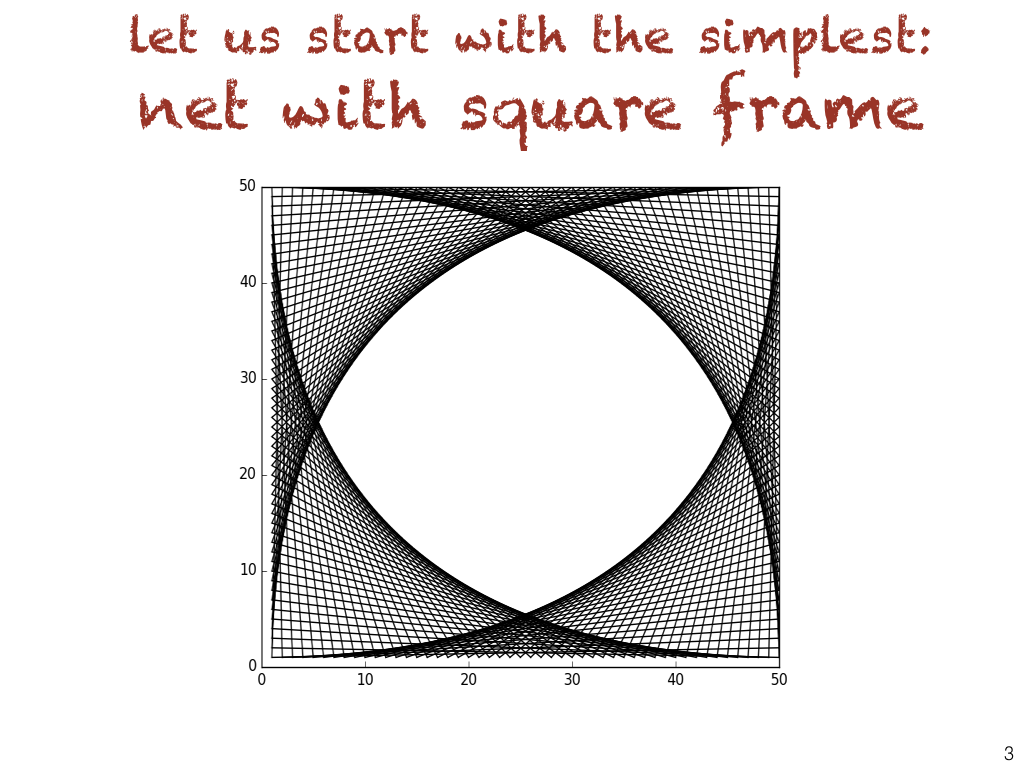
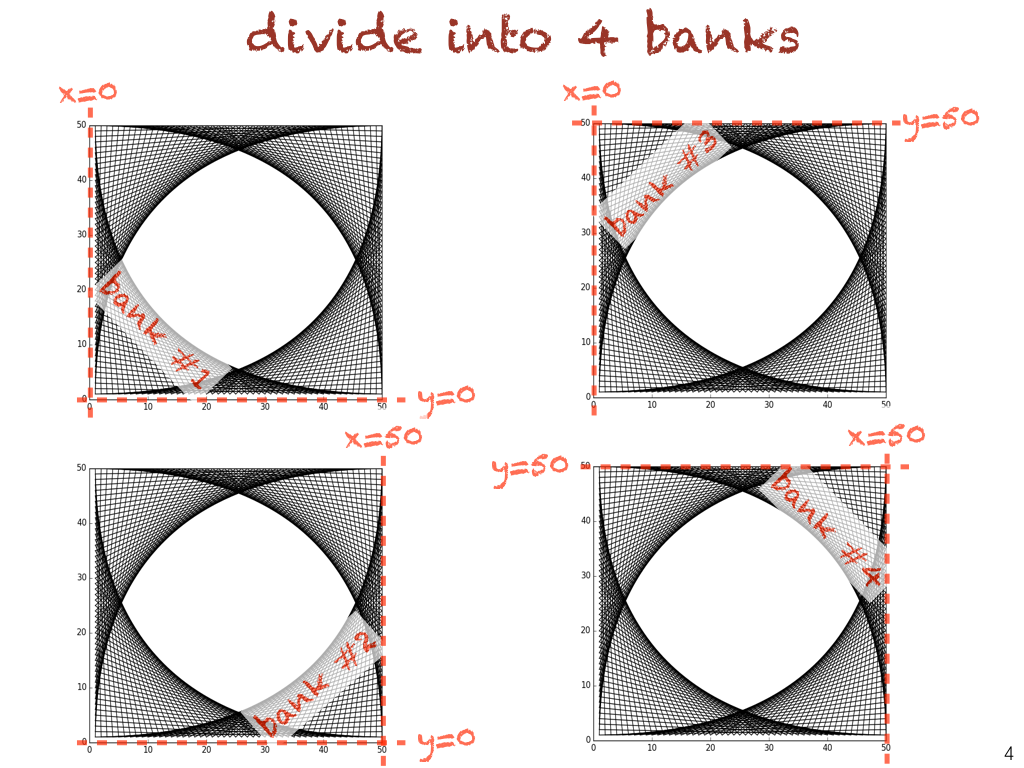
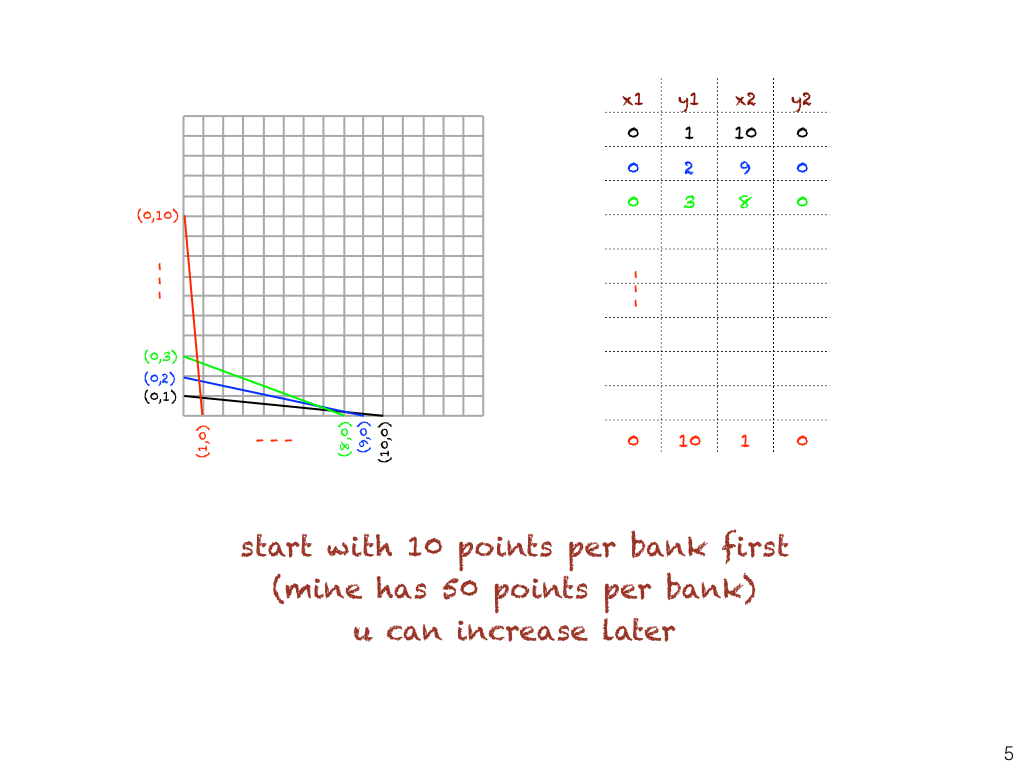
We shall plot out some pretty plots -- each consists of mathematically staggered straight lines, arranged using different number sequences. A beautiful showcase of loops and number sequences. Nothing but straight lines!
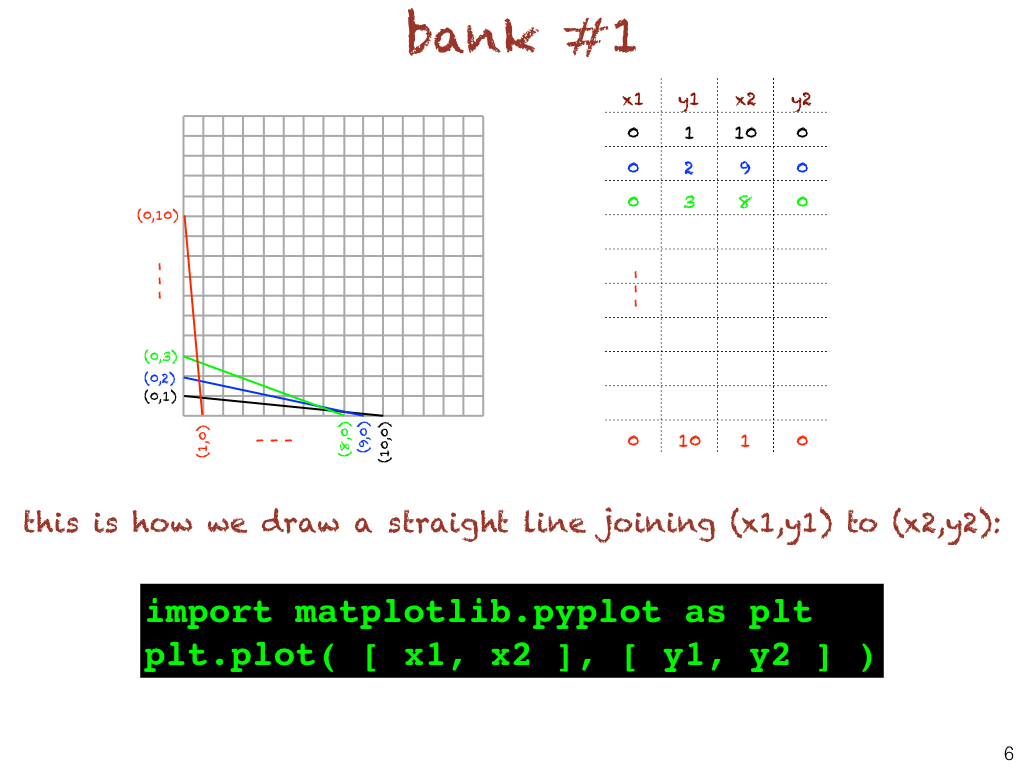
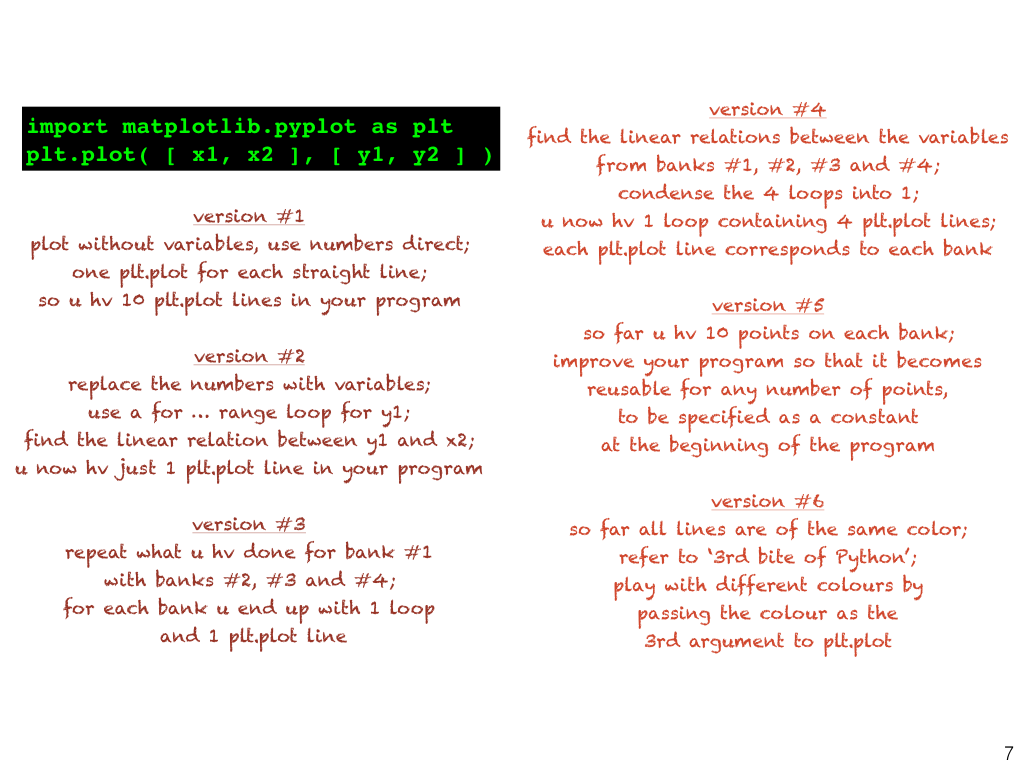
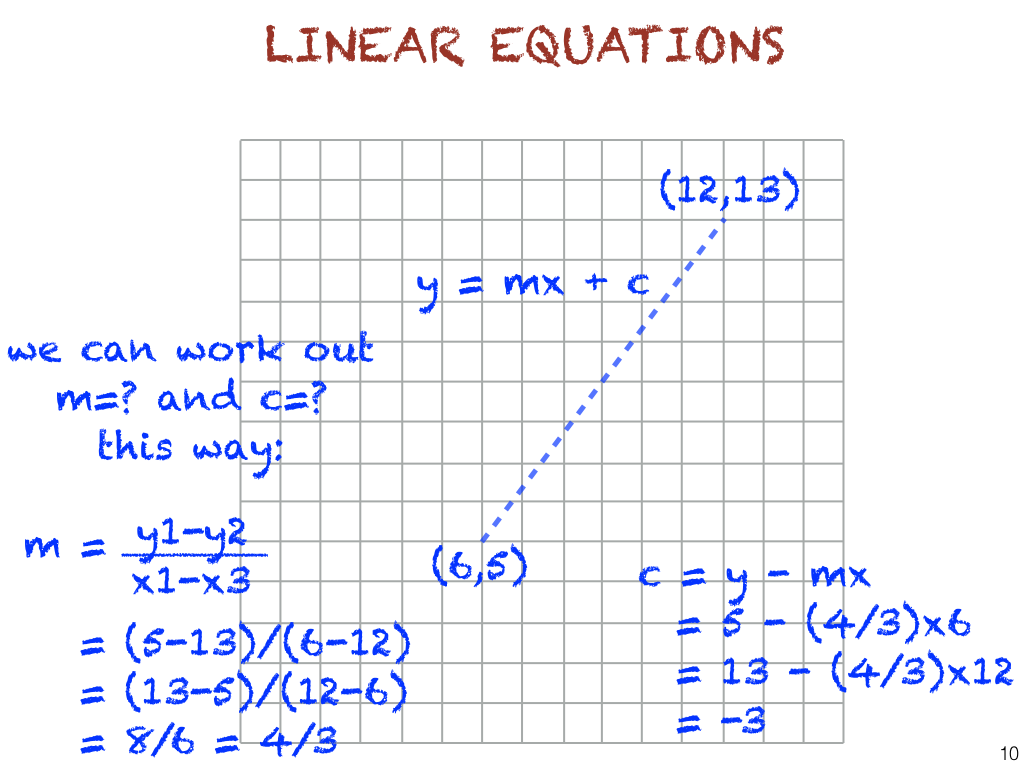
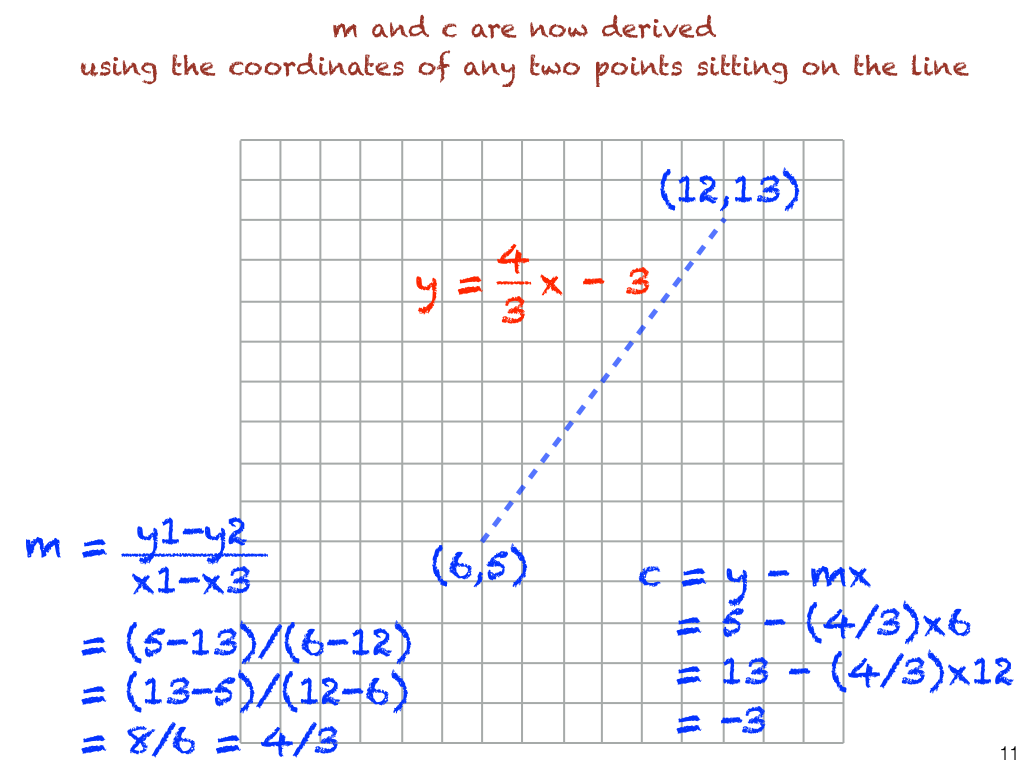
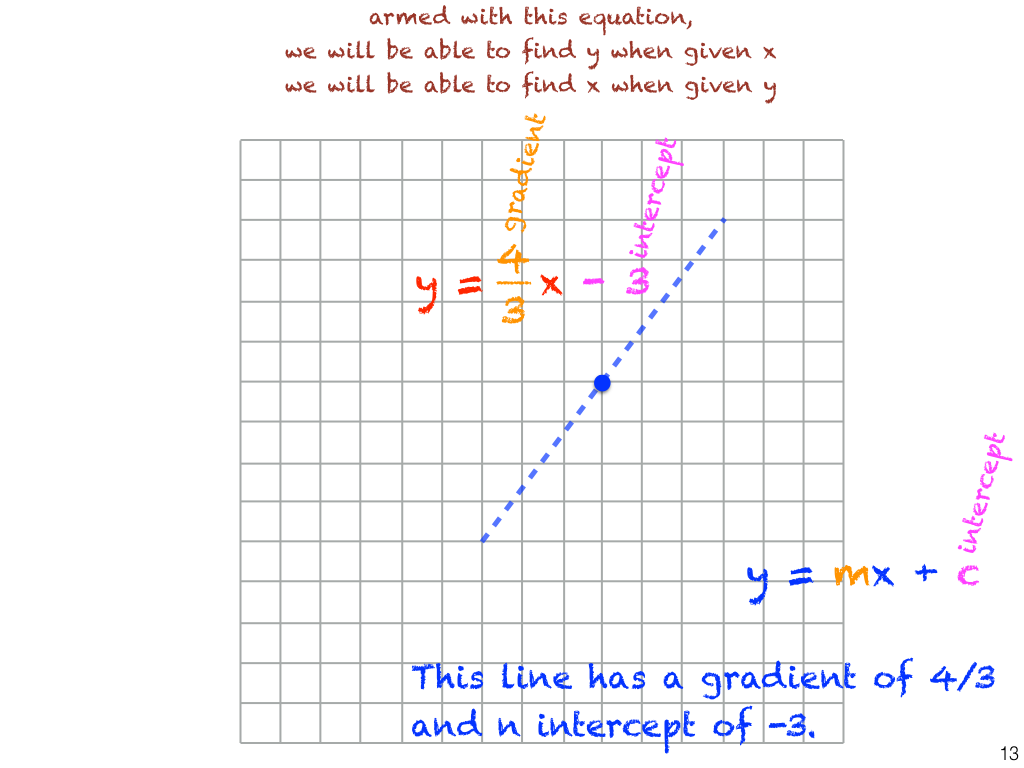
Here are the ingredients you need. Let us say we have two points. One point at coordinates (x,y) = (x1,y1). Another point at coordinates (x,y) = (x2,y2). To plot a straight line joining the two points, we use: import matplotlib.pyplot as plt plt.plot( [ x1, x2 ], [ y1, y2 ] ) plt.savefig('myfilename.png')
As an example, if we want to plot a straight line joining point (3,5) to point (17,2), we shall have: plt.plot( [3, 17], [5, 2] )
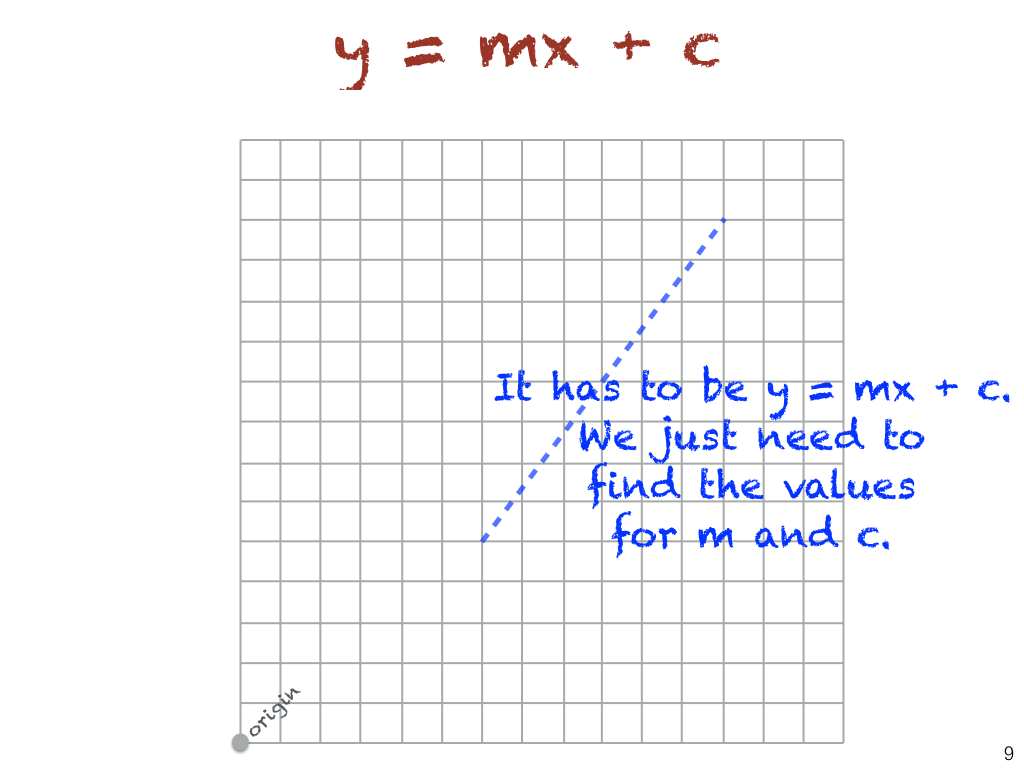
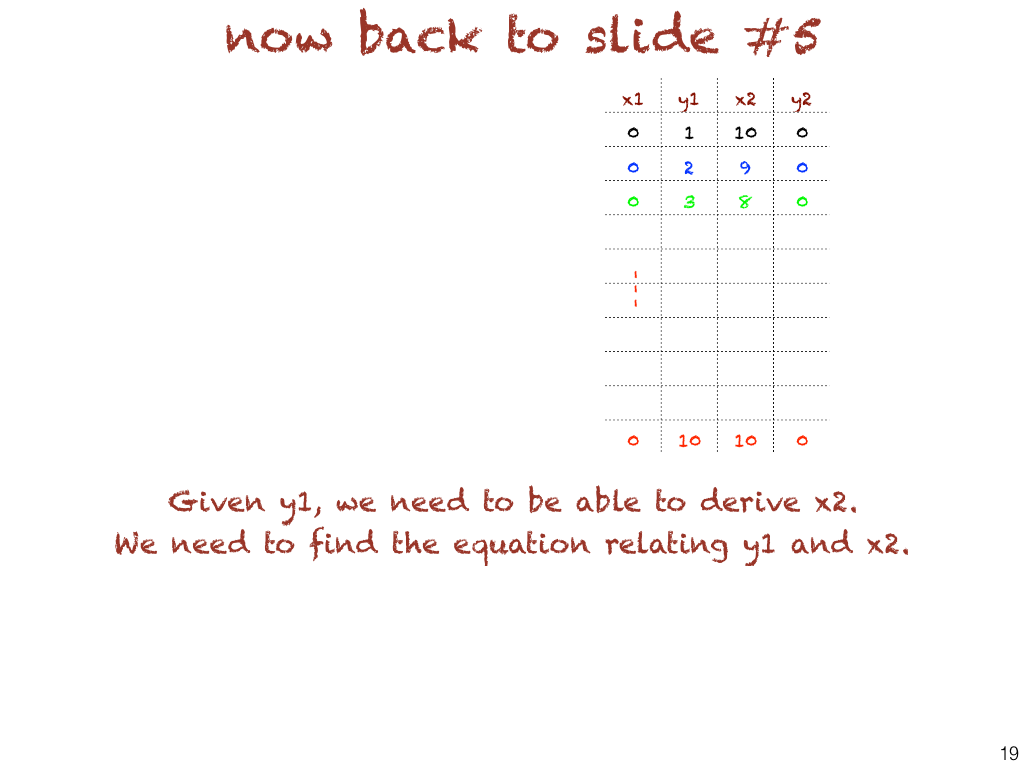
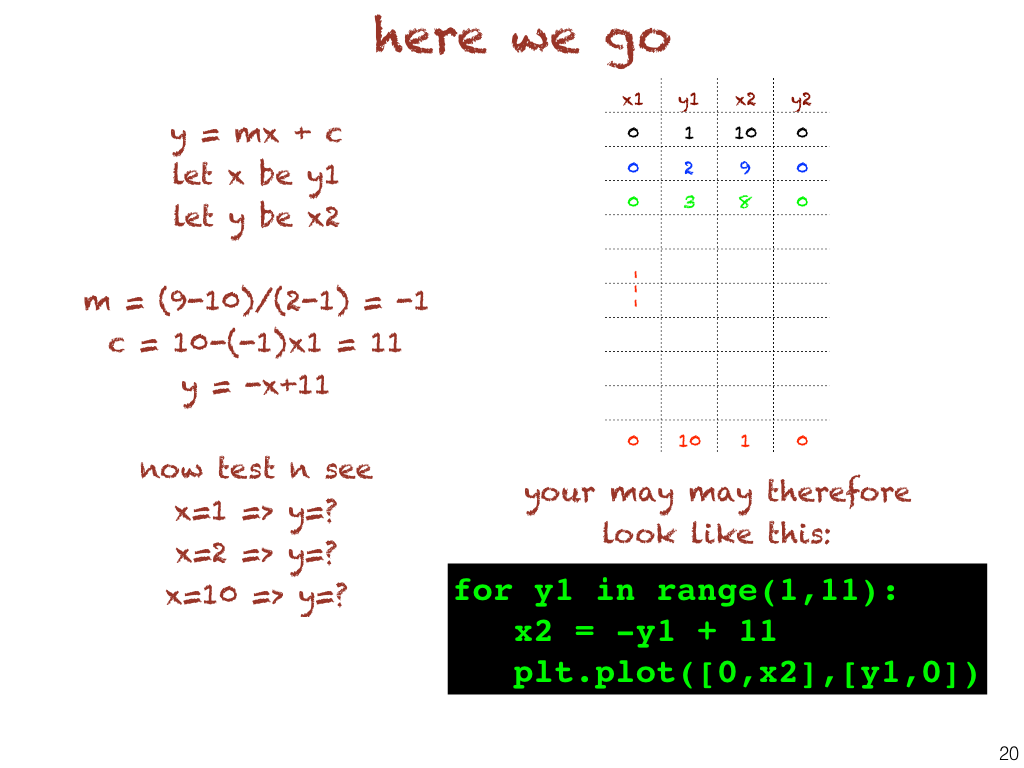
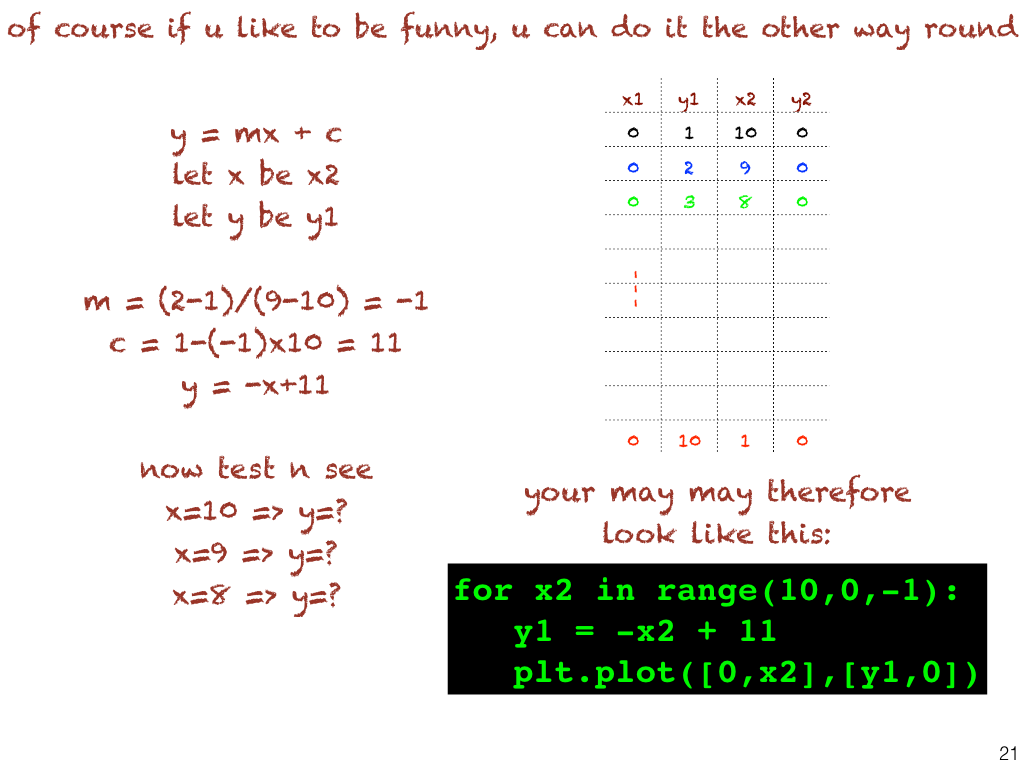
Where do we begin?
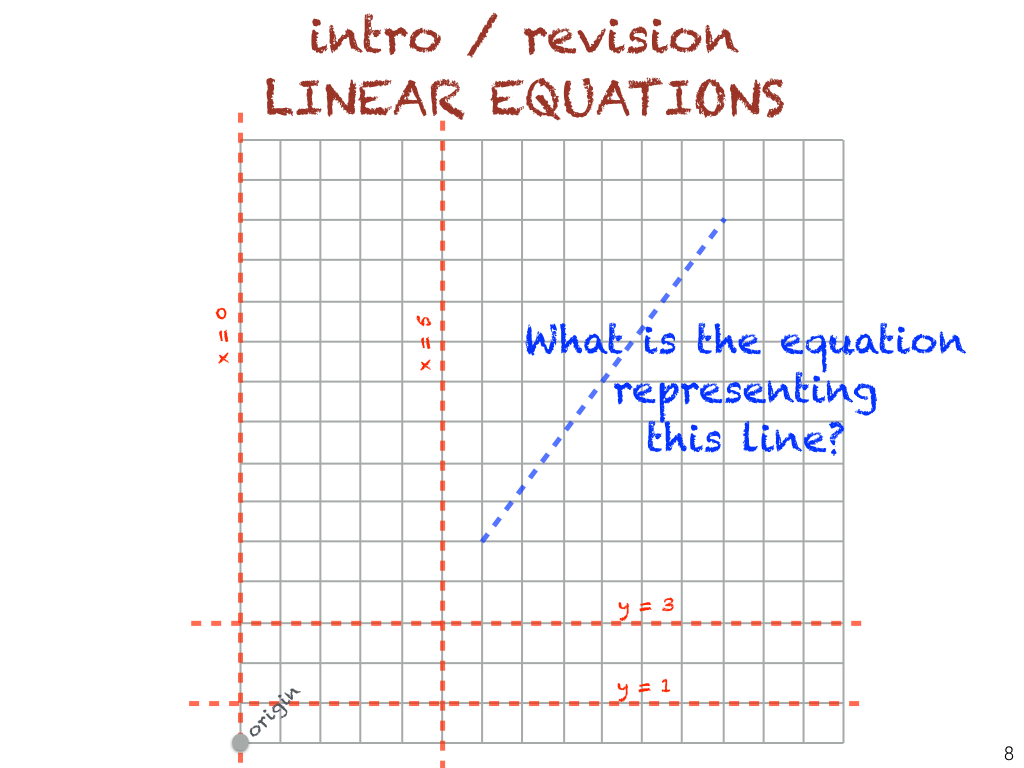
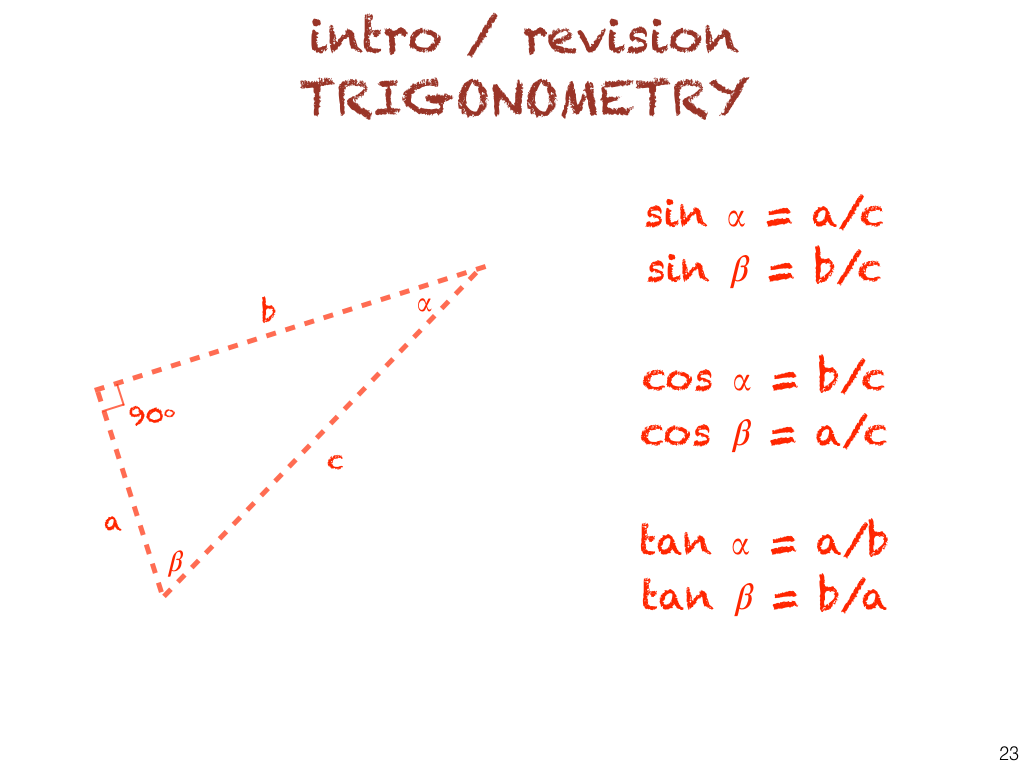
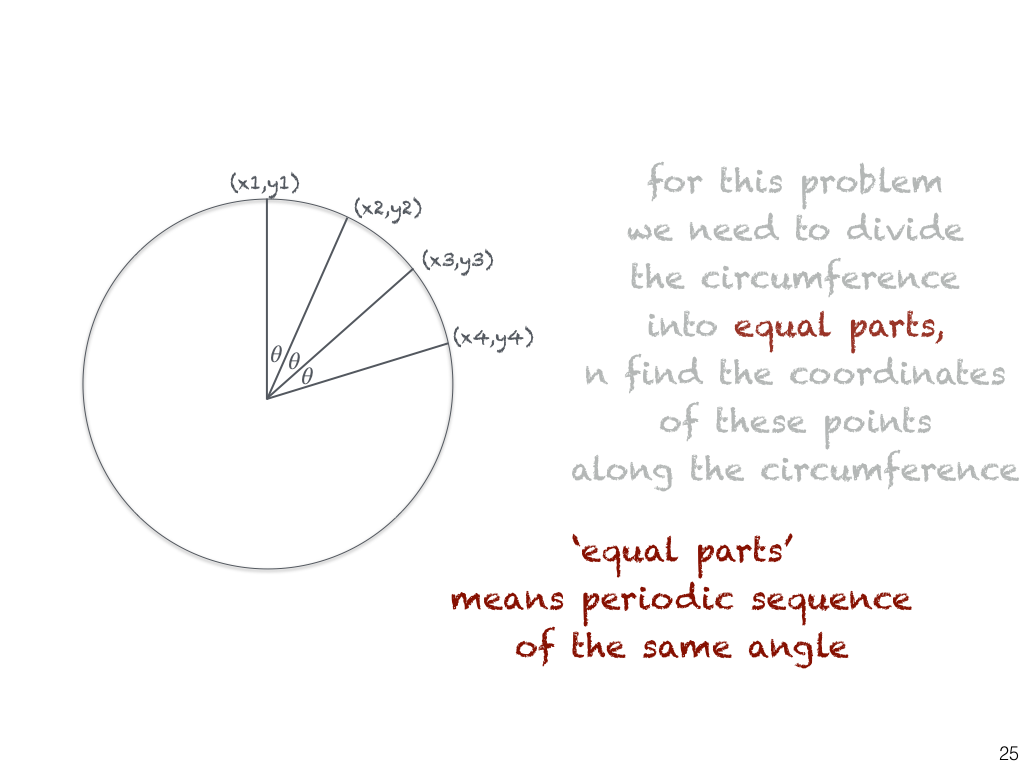
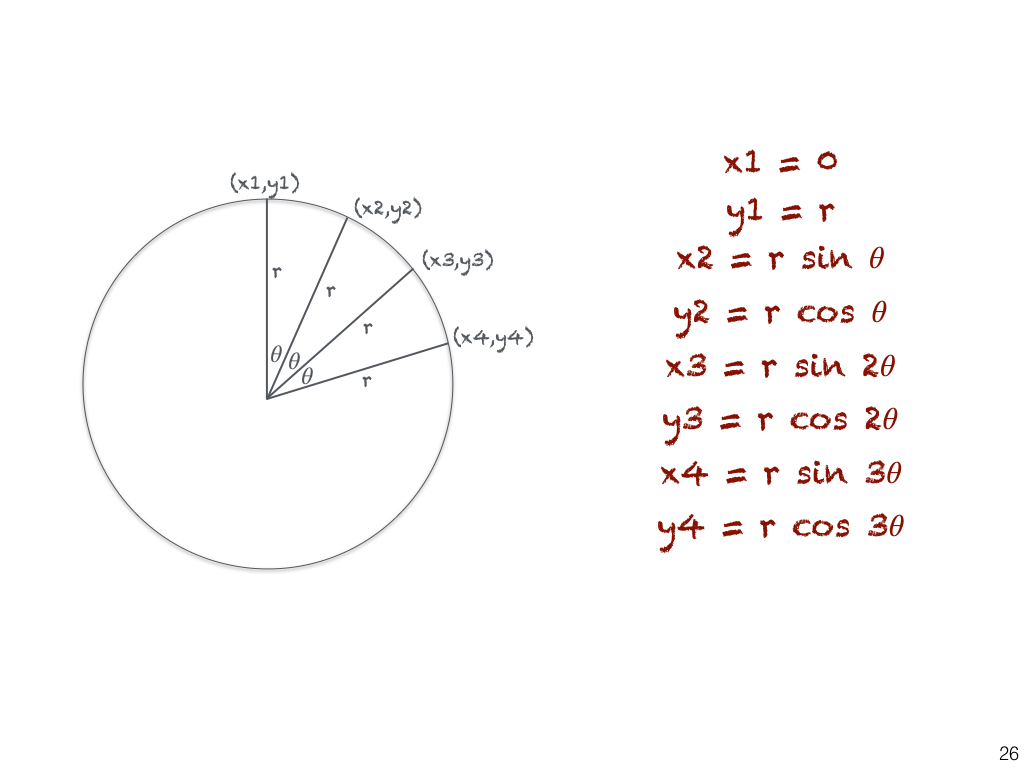
This will require some trigonometry, which is presented in the slides.